Explain in detail where the formula for the difference quotient comes
First of all, the way this works is that we don't have any numbers so we have to come up with the formula replacing the numbers for letters. x will represent the values on the x axis. h will represent the change in x.
First we get a point on the graph. that will be our starting point. That point will be (x, f(x)) it's this because the graph starts at a certain x point and the y point is related to the x point chosen therefore y is related to the function of x. now we have to find the second point. in the moment you move from x to the right, its not x anymore. It's x plus the change on x. therefore it'd be x+h, while the height would still be in relation to the its x value which in this case it's x+h that leaving us with the point (x+h, f(x+h)).
Now we have to find the slope between these two points. The formula to find the slope will still be the same m=(y2-y1)/(x2-x1). when we plug in the values the formula would be
[f(x+h) - f(x)]/[(x+h)-(x)] the top will stay the same while the in the bottom the x's will cancel leaving just h at the bottom. leaving us with the difference quotient formula.
works cited
http://images.tutorvista.com/cms/images/39/difference-quotient-formula.png
http://cis.stvincent.edu/carlsond/ma109/DifferenceQuotient_images/IMG0470.JPG
Friday, June 6, 2014
Monday, June 2, 2014
I/D#2 - Unit O Concept 7-8: Deriving Special Right Triangles
How can we derive the 30-60-90 triangle from an equilateral triangle with a side length of 1?
First we have the triangle as shown above.
Then we divide the triangle in half making one of the 60 degree angles become two 30 degree angles. By doing this we also create two 90 degree angles. Now we have to find the missing side being the dotted line. we can do this with the pythagorean theorem. With the bottom being 1/2 and the side being 1. The answer should be y = rad3 / 2. Then we multiply all the values of the triangle by two so that we don't have any fractions.
This should be the final result of the triangle.
How can we derive the 45-45-90 triangle from an square with a side length of 1?
First you draw the square and label each one of the sides one.
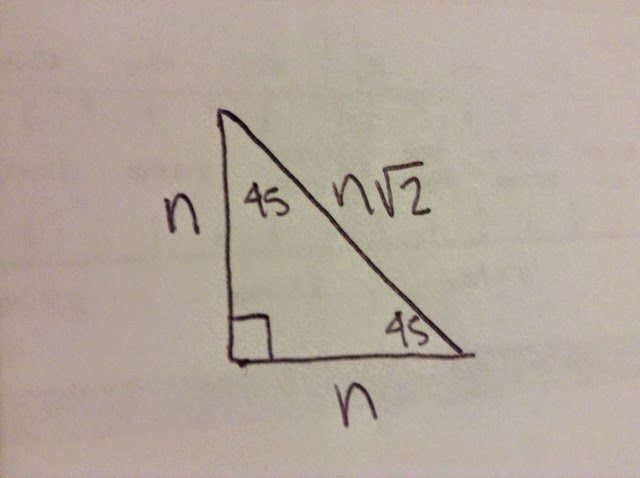
Then you make a diagonal dividing the square into two triangles. You may notice that these are the two triangles are the triangles that you're looking for (45, 45, 90)
Then you use the pythagorean theorem to find the length of r. this resulting to be rad2.
Then when you get that you multiply it by n so that you get the derivation of the 45 - 45 - 90 triangle, as shown below
Something I never noticed before about special right triangles is…
That they are derived from another shape and the angles come from there.
Being able to derive these patterns myself aids in my learning because…
now I where the formulas and the angles come form. if one day I don't remember how the concept works I can always come back here and know the basics of the special right triangles.
First we have the triangle as shown above.
Then we divide the triangle in half making one of the 60 degree angles become two 30 degree angles. By doing this we also create two 90 degree angles. Now we have to find the missing side being the dotted line. we can do this with the pythagorean theorem. With the bottom being 1/2 and the side being 1. The answer should be y = rad3 / 2. Then we multiply all the values of the triangle by two so that we don't have any fractions.
How can we derive the 45-45-90 triangle from an square with a side length of 1?
First you draw the square and label each one of the sides one.
Then you make a diagonal dividing the square into two triangles. You may notice that these are the two triangles are the triangles that you're looking for (45, 45, 90)
Then you use the pythagorean theorem to find the length of r. this resulting to be rad2.
Then when you get that you multiply it by n so that you get the derivation of the 45 - 45 - 90 triangle, as shown below
Something I never noticed before about special right triangles is…
That they are derived from another shape and the angles come from there.
Being able to derive these patterns myself aids in my learning because…
now I where the formulas and the angles come form. if one day I don't remember how the concept works I can always come back here and know the basics of the special right triangles.
SP #7: Unit Q concept 7. Finding all trig functions.
Monday, May 19, 2014
BQ #6 - UNIT U
1. What is continuity? What is discontinuity?
A continuous graph is a predictable, the graph will go where its intended to go. The graph has no jumps, holes or brakes. You can also draw this graph without lifting your pencil. As seen in the picture below.
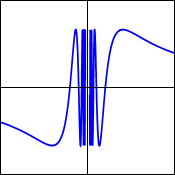
A discontinuity is something that stops the graph from being continuous. There are four types of discontinuities. There are point discontinuities that when graphed it still reaches the intended point but it has no value(this is a removable discontinuity). These next three are non removable discontinuities. There are jump discontinuities which is where the limit reached two different points leaving a gap that looks like a jump. There are infinite discontinuities. These occur when there is a vertical asymptote which results in unbounded behavior, making the graph go towards infinity. and the last one is oscillating discontinuity, this graph just looks very wiggly. The reason why this is a discontinuity is because the graph doesn't know where it wants to go.
here we see how a jump discontinuity looks then we see two holes and finally we see and infinite discontinuity
This is an oscillating discontinuity
2. What is a limit? When does a limit exist? When does a limit not exist? What is the difference between a limit and a value
the definition of a limit is the intended height of a function. The limit exists whenever both the left side of the function and the right side of the function meet. a limit does not exist in the non removable discontinuities because both sides of the graph do not get to the intended height.
like said before, the limit is the intended height of the function, that does not mean that the point will always be there. the value is the actual number or the actual height that the graph reached.
3. How do we evaluate limits numerically, graphically, and algebraically?
You can evaluate limits numerically using and using the closes values to the number.
You evaluate the limits graphically by using the graph and with two different points you make those two points meet. if they meet then that's the limit, if they do not meet then the limit does not exist.
algebraically. there are different methods to evaluate a graph algebraically. The firs one is substitution, on here all you have to do is plug in the number and solve. this can give you four different answers. a number, 0, undefined, or indeterminate. if you get that last one then you have to try the other methods, if not, you're done with the problem. The other method is the factoring/divide method. Here you look to factor the function in order to find something to cancel. then after canceling then you try substitution again. the last method is the rationalizing/conjugate method. Here you use the factor with the radical sign and you rationalize it in order to be able to cancel some stuff out and then you can try substitution again.
Works cited
http://images.tutorcircle.com/cms/images/tcimages/types-of-discontinuity-in-calculus-functions-1330067235.jpg
http://www.milefoot.com/math/calculus/limits/images/oscdisc.gif
Tuesday, April 22, 2014
BQ#4 – Unit T Concept 3
The way that a tangent and a cotangent graph go has to do a lot with the asymptotes. The position of the asymptote describes where the graph has to go. You also have to take into account how the way that the sign of the graph has been determined already. For that reason the "normal" tangent graph goes uphill and the "normal" tangent graph goes downhill.
BQ#3 – Unit T Concepts 1-3
These two graphs when seen without a background the graphs look just the same. What differs these two are where the graph starts. Other than that the graphs are very similar. Both of them have two parts in the negative section and two in the positive one. The period for both of these are 2pi. They both have amplitude, for that reason, these two typed of graphs are very similar.
Thursday, April 17, 2014
BQ#5 – Unit T Concepts 1-3: Asymptotes
Why do sine and cosine NOT have asymptotes, but the other four trig graphs do? Use unit circle ratios to explain.
First of all, we should be familiar that asymptotes happen whenever we get undefined. The only way to get undefined is to be divided by zero. If we refer to the circle ratios of sine and cosine the ratios would be sin=y/r and cos=x/r. We know that r will always equal one so there is no way that sine and cosine will randomly appear with a zero on the bottom. However, every other trig ratio have some value in which the bottom can equal zero, making it possible for them to have an asymptote.
Wednesday, April 16, 2014
BQ#2 – Unit T Concept Intro: How do the trig graphs relate to the Unit Circle?
Period? - Why is the period for sine and cosine 2pi, whereas the period for tangent and cotangent is pi?
The reason why sine and cosine have a period of 2pi is because that's how long it takes for a sine/cosine graph to repeat itself. The repetitions are based on the signs of the trig function and the unit circle. Whereas tangent, tangent repeats the sign pattern in the unit circle, so for it to complete a repeated cycle. So in 2pi there would be 2 graphs looking exactly the same for that reason only 1 pi is needed for the graph.
Amplitude? – How does the fact that sine and cosine have amplitudes of one (and the other trig functions don’t have amplitudes) relate to what we know about the Unit Circle?
We have to remember that in the unit circle, a value greater than 1 and less than -1 would result as an error, because the values cannot be greater than that on the unit circle. for that reason those are used as amplitudes while graphing a sine/cosine graph.
Works Cited
http://edunettech.blogspot.com/2013/10/the-graphs-of-six-trigonometric.html
Thursday, April 3, 2014
Reflection# 1: Unit Q, Trigonometric Identities
What does it actually mean to verify a trig identity?
When we are asked to verify an identity what we have to do is make sure that both sides equal each other exactly. we can do this by substituting trig functions with each other. No matter what, both sides equal the same thing. we just have to check that its true.
What tips and tricks have you found helpful?
Well the best tip for this unit is memorize the identities. If you know your identities you can look at a problem and be ahead of the problem. There were times where i knew what i was going to do in the problem two steps before i actually did them. This was thanks to me memorizing the identities.
Explain your thought process and steps you take in verifying a trig identity. Do not use a specific example, but speak in general terms of what you would do no matter what they give you.
The first thing that i would see is what are the terms in which we have to end up with. Is it going to be a fraction? Do they cancel at the end? these are some questions that go through my mind in the beginning. then if i have a fraction i try to get rid of the bottom part if possible. then i try to set everything to sin and cosine. so that later i can just move those two around to turn them into the trig function it has to equal to.
Monday, March 24, 2014
ID#3 Unit Q: Concept 1 : Pythagorean Identites
Where does where sin2x+cos2x=1 come from?
First we have to remember that the Pythagorean theorem is an identity, and what this means is that no matter what the formula will always be true. When we use x, y, and r means that we are basing things on the unit circle. for this reason the identity is equal to 1, because we are basing ourselves on how the unit circle always equals to one. we know that the ratio of cosine in the unit circle is x/r and the ratio of sine in the unit circle is y/r. What i notice is that everything of this is related to the unit circle and the ratios in it. for that reason is that the identity of sin2x+cos2x=1.
Show and explain how to derive the two remaining Pythagorean Identities from sin2x+cos2x=1
One of the first things that you should do is to decide which trig function you want to derive. if it's sin firs you have to move sine to the other side and do the same with the one ending up with 1 - cos2x = sin2x. and you do the same thing for cosine ending up with 1 - sin2x = cos2x.
The connections that I see between Units N, O, P, and Q so far are that all the trigonometric functions in the end connect with each other. They all come back to its origins which for us was the unit circle.
If I had to describe trigonometry in THREE words, they would be... Relationship, Angles, Confusing
BQ# 1: Unit P Concept 1,2, and 4: Law of Sines, Area of Oblique Triangle
The Law of Sines
First of all this law is used whenever we get a non-right triangle in which the normal Trigonometric functions can't be used. This is used to find angles and sides of triangles with different angles and sides. The triangle should be labeled A, B, and C for the angles. Then after that we should label the sides with the same lower case letters, labeling the side opposite to the angle. You must divide the triangle into two creating a line representing the height and with that we can start to work with sines. From this point we can get two different equations. SinA=h/b and SinC=h/c. if we get these two formulas and divide them with each other we notice that we end up with the law of sines being SinA/a=SinC/c.
Area formulas - How is the “area of an oblique” triangle derived?
The formula of an oblique triangle that everyone know is Area=(h*b)/2. What we do here is that we want to use this same formula but to find a missing angle on the triangle that we don't know. Since we dont care about finding h what we have to do is substitute it. Through the knowledge that we have have of trig functions we know that we can replace h with something else. In this case h would equal a times the Sin A. this would be plugged in inside our old formula and eventually we would reach the point where our new formula would equal a = 1/2b(csinA)
This video went through how the formula is used and gives a more clear example oh how the formula comes from and how it should be used for these kinds of triangles.
WORKS CITED
Law of sines picture
http://www.drcruzan.com/Images/TrigNonRight/LOS_Derivation.png
WPP 13/14 Unit P concepts 6/7
This blog post has been made in collaboration with Damian G and Tommy O. Please click HERE to see the WPP along with other very cool posts.
Wednesday, March 5, 2014
WPP #12: Unit O Concept 10-Angle of Elevation and Depression
a. Marty is standing on top of the stage and he's about to start his show. He spots his mom in the audience and wants to know how far away is she. The angle of depression is 38 degrees and the height of the stage is 28 feet. How far away is Marty's mom?
b. One of the fans wants to know how far away she is from the stage. The height of the stage is still 28 feet. The angle of elevation is 5 degrees. How far away is the fan?
Saturday, February 22, 2014
I/D# 1: Unit N Concept 7: Special Right Triangles and the Unit Circle
INQUIRY ACTIVITY SUMMARY
As we know there are several right triangles. However, there are three examples of right triangles that we call "Special Right Triangles." These triangles are the 30, 45, and 60 degrees triangles, which have some special features as shown in the pictures below.
http://dj1hlxw0wr920.cloudfront.net/userfiles/wyzfiles/6d31e6a7-f698-4f44-b2d2-953443b2e5bd.png *(edited by me)
30 degrees
First we labeled the rules of this special right triangle. Them being the hypotenuse is 2x, vertical value = x and horizontal value = x√3.
The next step to this triangle was to find a way to which we can make the hypotenuse equal 1. The way to do this is to divide 2x by itself making it equal 1. As we know, whenever a change is done to a side, the same change must be done to the other sides. Due to this, we divide x and y by 2x leaving us with horizontal value = √3 / 2 and vertical value = 1 / 2
Now you just equal the hypotenuse to r, horizontal value to x and vertical value to y. r = 1, x = √3 / 2, and y = 1 / 2.
Then you draw a plane on the triangle so that the triangle lies on quadrant I
Finally you label the three points on the triangle. The points for this triangle should be (0,0), (√3 / 2, 0), (√3 / 2, 1 / 2)
45 Degrees
First we labeled the rules of this special right triangle. Them being
the hypotenuse is x√2, vertical value being x and horizontal value also being x.
The next step to this triangle is to find a way to which we can make
the hypotenuse equal 1. The way to do this is to divide x√2 by itself
making it equal 1. As we know, whenever a change is done to a side, the
same change must be done to the other sides. Due to this, we divide the horizontal and vertical values by x√2 leaving us with horizontal value = √2 / 2 and vertical value
= √2 / 2.
Now you just equal the hypotenuse to r, horizontal value to x and vertical value to y. r = 1, x = √2 / 2, and y = √2 / 2.
Then you draw a plane on the triangle so that the triangle lies on quadrant I
In the end, you label the three points on the triangle. The points for this triangle should be (0,0), (√2 / 2, 0), (√2 / 2, √2 / 2)
60 Degree
First we labeled the rules of this special right triangle. Them being
the hypotenuse is 2x, vertical value = x√3 and horizontal value = x.
The next step to this triangle was to find a way to which we can make
the hypotenuse equal 1. The way to do this is to divide 2x by itself
making it equal 1. As we know, whenever a change is done to a side, the
same change must be done to the other sides. Due to this, we divide x
and y by 2x leaving us with horizontal value = 1 / 2 and vertical value
= √3 / 2.
Now you just equal the hypotenuse to r, horizontal value to x and vertical value to y. r = 1, x = 1 / 2, and y =√3 / 2.
Then you draw a plane on the triangle so that the triangle lies on quadrant I.
Finally you label the three points on the triangle. The points for this triangle should be (0,0), (1 / 2, 0), (1 / 2, √3 / 2)
How does this activity help you to derive the Unit Circle?
This activity helped me not only to find the points that we will be using in the unit circle later in the unit but also to visualize where those points came from. Now these points are not just random numbers that were thrown at me to memorize. I understand the background of the numbers, and how they relate to the angles. This activity will also help when I have to use the trig functions because I will know which numbers I have to use for each one of the functions. In conclusion, this activity helped me understand where the unit circle's values come from and how I can use them later in the unit.
Quadrants and Signs
Something that is very interesting about these triangles is that once you found the I quadrant you can figure out what the other sides are because the values will be the same the values will just change signs. First,you base yourself on the reference angle to measure the 30, 45, and 60 degrees.Once you do this you can start assigning the numbers. On Quadrant II , the numbers will be the same. The only thing that will change will be the sign on the x value. On Quadrant III, you still base yourself on the reference angles, then the change on this quadrant will be that both the x and y value will be negative. Finally, in Quadrant IV they only change that has to be done is that the y value will be the only one negative. x will stay positive.
INQUIRY ACTIVITY REFLECTION
The coolest thing I learned from this activity was…how everything that we learned in the unit falls together through something like this (unit circle). I also found very interesting how past courses such as geometry and algebra II had such a great influence on something like this where you relate angles with circles and triangles.
This activity will help me in this unit because… it will help me not only know the values that i will be needing when I need to use the unit circle but to understand where it comes from. So that in case I ever forget how all these numbers came to be and I forget the values I know where I can get these values
Something I never realized before about special right triangles and the unit circle is… how the both of them compliment each other so much. I never thought that through triangles I'd understand how a circle works and through that we can find different values along with the trig functions.
Monday, February 10, 2014
RWA #1: Unit M: Concept 5: Graphing Ellipses Given Equation.
Definiton: A set of all points such that the sum of the distance from two points is a constant
Description:
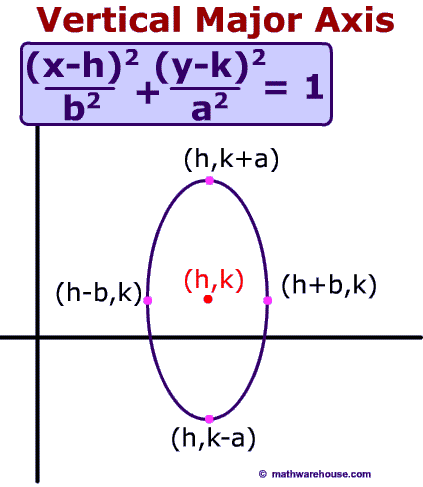
There are several parts on the ellipse. Some of the most important ones are the center, the vertices and the co-vertices.We can indentify these parts either with the formula or wiht the graph. The center will be where the line of the two vertices and the co vertices cross. we can find the center by plotting h and k from the formula.
The focus on this graph is used to determine where the the points around the center will be found. as said in the description, the Focus work as the two point in which the number has to be constant to create what we know as an ellipse.
In the first example of the graph we see how the distance of the two points does not change and it helps us visualize the way an ellipse is plotted.
RWA:
One of the biggest examples of ellipses that we have around us is the way that planets rotate around the sun. if we have ever seen a sketch of the way planets rotate around the sun, we see that the trajectory isn't a perfect circle. The orbit creates a shape that is stretched out from the sides which is commonly known as an oval, but in mathematical terms, its an ellipse.
This giant ellipse that the earth creates as it goes around the sun affects us through the stations. The earth is found at different points throughout the trajectory, when the earth is close to the sun there is when we have summer. The time when the earth is found far away from the sun then that's the season that we call fall.
To learn more about it you may visit this site. Click HERE
Works Cited
http://hyperphysics.phy-astr.gsu.edu/hbase/kepler.html
http://www.mathwarehouse.com/ellipse/images/translations/general_formula_major.gif
http://www.youtube.com/watch?v=1v5Aqo6PaFw
Subscribe to:
Posts (Atom)