Explain in detail where the formula for the difference quotient comes
First of all, the way this works is that we don't have any numbers so we have to come up with the formula replacing the numbers for letters. x will represent the values on the x axis. h will represent the change in x.
First we get a point on the graph. that will be our starting point. That point will be (x, f(x)) it's this because the graph starts at a certain x point and the y point is related to the x point chosen therefore y is related to the function of x. now we have to find the second point. in the moment you move from x to the right, its not x anymore. It's x plus the change on x. therefore it'd be x+h, while the height would still be in relation to the its x value which in this case it's x+h that leaving us with the point (x+h, f(x+h)).
Now we have to find the slope between these two points. The formula to find the slope will still be the same m=(y2-y1)/(x2-x1). when we plug in the values the formula would be
[f(x+h) - f(x)]/[(x+h)-(x)] the top will stay the same while the in the bottom the x's will cancel leaving just h at the bottom. leaving us with the difference quotient formula.
works cited
http://images.tutorvista.com/cms/images/39/difference-quotient-formula.png
http://cis.stvincent.edu/carlsond/ma109/DifferenceQuotient_images/IMG0470.JPG
Creative Title
Friday, June 6, 2014
Monday, June 2, 2014
I/D#2 - Unit O Concept 7-8: Deriving Special Right Triangles
How can we derive the 30-60-90 triangle from an equilateral triangle with a side length of 1?
First we have the triangle as shown above.
Then we divide the triangle in half making one of the 60 degree angles become two 30 degree angles. By doing this we also create two 90 degree angles. Now we have to find the missing side being the dotted line. we can do this with the pythagorean theorem. With the bottom being 1/2 and the side being 1. The answer should be y = rad3 / 2. Then we multiply all the values of the triangle by two so that we don't have any fractions.
This should be the final result of the triangle.
How can we derive the 45-45-90 triangle from an square with a side length of 1?
First you draw the square and label each one of the sides one.
Then you make a diagonal dividing the square into two triangles. You may notice that these are the two triangles are the triangles that you're looking for (45, 45, 90)
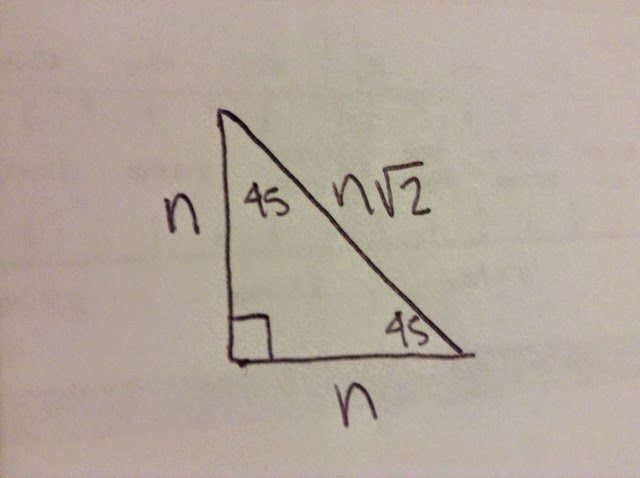
Then you use the pythagorean theorem to find the length of r. this resulting to be rad2.
Then when you get that you multiply it by n so that you get the derivation of the 45 - 45 - 90 triangle, as shown below
Something I never noticed before about special right triangles is…
That they are derived from another shape and the angles come from there.
Being able to derive these patterns myself aids in my learning because…
now I where the formulas and the angles come form. if one day I don't remember how the concept works I can always come back here and know the basics of the special right triangles.
First we have the triangle as shown above.
Then we divide the triangle in half making one of the 60 degree angles become two 30 degree angles. By doing this we also create two 90 degree angles. Now we have to find the missing side being the dotted line. we can do this with the pythagorean theorem. With the bottom being 1/2 and the side being 1. The answer should be y = rad3 / 2. Then we multiply all the values of the triangle by two so that we don't have any fractions.
How can we derive the 45-45-90 triangle from an square with a side length of 1?
First you draw the square and label each one of the sides one.
Then you make a diagonal dividing the square into two triangles. You may notice that these are the two triangles are the triangles that you're looking for (45, 45, 90)
Then you use the pythagorean theorem to find the length of r. this resulting to be rad2.
Then when you get that you multiply it by n so that you get the derivation of the 45 - 45 - 90 triangle, as shown below
Something I never noticed before about special right triangles is…
That they are derived from another shape and the angles come from there.
Being able to derive these patterns myself aids in my learning because…
now I where the formulas and the angles come form. if one day I don't remember how the concept works I can always come back here and know the basics of the special right triangles.
SP #7: Unit Q concept 7. Finding all trig functions.
Monday, May 19, 2014
BQ #6 - UNIT U
1. What is continuity? What is discontinuity?
A continuous graph is a predictable, the graph will go where its intended to go. The graph has no jumps, holes or brakes. You can also draw this graph without lifting your pencil. As seen in the picture below.
A discontinuity is something that stops the graph from being continuous. There are four types of discontinuities. There are point discontinuities that when graphed it still reaches the intended point but it has no value(this is a removable discontinuity). These next three are non removable discontinuities. There are jump discontinuities which is where the limit reached two different points leaving a gap that looks like a jump. There are infinite discontinuities. These occur when there is a vertical asymptote which results in unbounded behavior, making the graph go towards infinity. and the last one is oscillating discontinuity, this graph just looks very wiggly. The reason why this is a discontinuity is because the graph doesn't know where it wants to go.
here we see how a jump discontinuity looks then we see two holes and finally we see and infinite discontinuity
This is an oscillating discontinuity
2. What is a limit? When does a limit exist? When does a limit not exist? What is the difference between a limit and a value
the definition of a limit is the intended height of a function. The limit exists whenever both the left side of the function and the right side of the function meet. a limit does not exist in the non removable discontinuities because both sides of the graph do not get to the intended height.
like said before, the limit is the intended height of the function, that does not mean that the point will always be there. the value is the actual number or the actual height that the graph reached.
3. How do we evaluate limits numerically, graphically, and algebraically?
You can evaluate limits numerically using and using the closes values to the number.
You evaluate the limits graphically by using the graph and with two different points you make those two points meet. if they meet then that's the limit, if they do not meet then the limit does not exist.
algebraically. there are different methods to evaluate a graph algebraically. The firs one is substitution, on here all you have to do is plug in the number and solve. this can give you four different answers. a number, 0, undefined, or indeterminate. if you get that last one then you have to try the other methods, if not, you're done with the problem. The other method is the factoring/divide method. Here you look to factor the function in order to find something to cancel. then after canceling then you try substitution again. the last method is the rationalizing/conjugate method. Here you use the factor with the radical sign and you rationalize it in order to be able to cancel some stuff out and then you can try substitution again.
Works cited
http://images.tutorcircle.com/cms/images/tcimages/types-of-discontinuity-in-calculus-functions-1330067235.jpg
http://www.milefoot.com/math/calculus/limits/images/oscdisc.gif
Tuesday, April 22, 2014
BQ#4 – Unit T Concept 3
The way that a tangent and a cotangent graph go has to do a lot with the asymptotes. The position of the asymptote describes where the graph has to go. You also have to take into account how the way that the sign of the graph has been determined already. For that reason the "normal" tangent graph goes uphill and the "normal" tangent graph goes downhill.
BQ#3 – Unit T Concepts 1-3
These two graphs when seen without a background the graphs look just the same. What differs these two are where the graph starts. Other than that the graphs are very similar. Both of them have two parts in the negative section and two in the positive one. The period for both of these are 2pi. They both have amplitude, for that reason, these two typed of graphs are very similar.
Thursday, April 17, 2014
BQ#5 – Unit T Concepts 1-3: Asymptotes
Why do sine and cosine NOT have asymptotes, but the other four trig graphs do? Use unit circle ratios to explain.
First of all, we should be familiar that asymptotes happen whenever we get undefined. The only way to get undefined is to be divided by zero. If we refer to the circle ratios of sine and cosine the ratios would be sin=y/r and cos=x/r. We know that r will always equal one so there is no way that sine and cosine will randomly appear with a zero on the bottom. However, every other trig ratio have some value in which the bottom can equal zero, making it possible for them to have an asymptote.
Subscribe to:
Posts (Atom)